
Demos
Seeing the shape of an entire information space.
A look at how Metiscope turns something too vast to read into something you can navigate, explore, and reason about.
Kindle Library: A Map of What You Own
About this demo
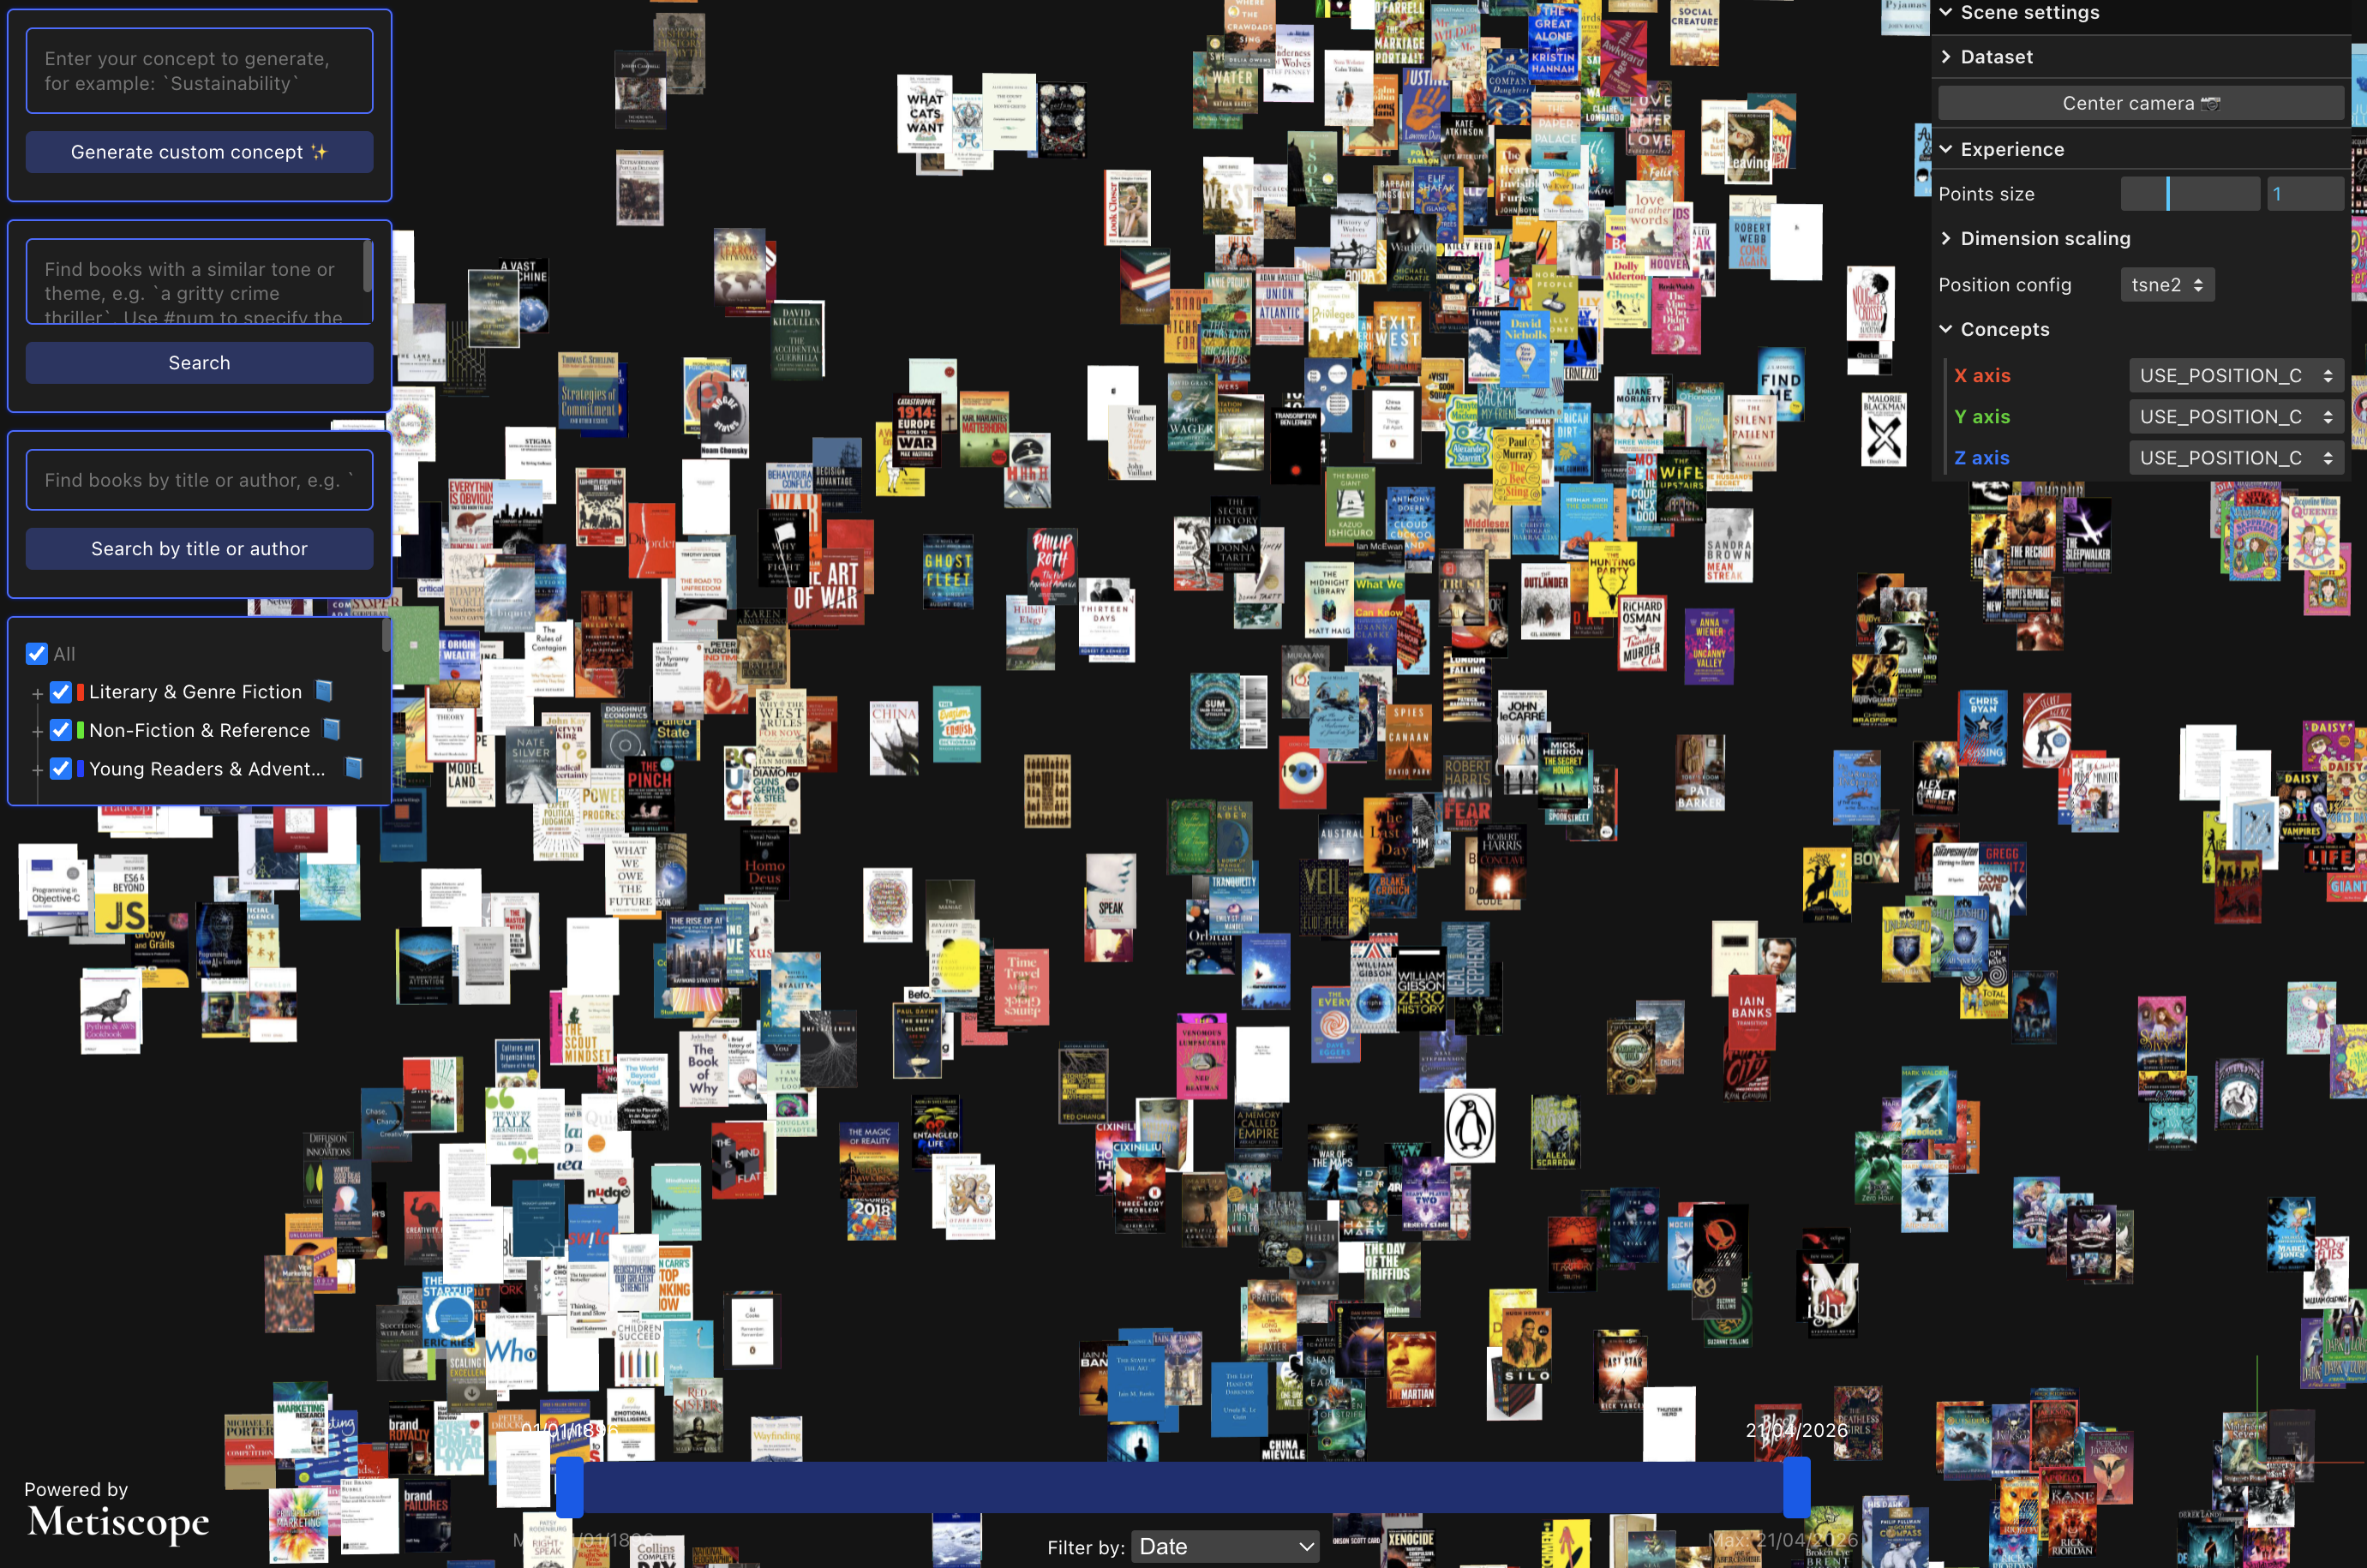
Traditionally books live on shelves. In bookshops they are sorted into categories, providing a physical semantic map allowing you to walk around, build a sense of what is there and, potentially, find something interesting to read. It may not necessarily be the most efficient mechanism of finding a specific book, but it is a good way of discovering something you might not be looking for, or even know exists.
A Kindle library provides the opposite. It provides an efficient way of searching for something specific within a large catalogue, but it is very hard to build an understanding of the whole catalogue. An AI facilitated search could help, as an AI can build a very detailed map of the content, but how does it communicate that understanding to a human? A chat based interface is a very low bandwidth channel to convey the breadth and depth of content in even a small catalogue.
This demo rebuilds the bookshelf in digital form. It shows the contents of a personal Kindle library of over 1,000 books.
Every book in the library can be placed in space by theme and tone, not alphabetically or by genre, so books that feel similar sit near each other, whether or not a bookshop would ever put them on the same shelf. Those concepts can be changed to suit the particular tastes and needs of the user. The library can be reorganised by concepts such as “morally ambiguous,” “technological dystopia,” or “coming-of-age,” which have been generated automatically from each book's description. Entirely new concepts can be generated dynamically and the library will reorder accordingly.
Books have been grouped into hierarchical clusters based on similarity, but new clusters can be created as well according to need. And you can search for a specific title or author, if you really want.
Library
1,035 books
Organisation
Theme & tone embeddings
Interaction
Semantic search & concept filters
Why it matters
This library is personal. The real opportunity is any collection too large to hold in your head.
We live in a world where we are overwhelmed by content: photo libraries, document archives, research corpora, product catalogues and marketing materials. Generative technologies are only going to make it worse. You can choose to offload the task of understanding it to an AI, but then how can that be applied to your own knowledge and judgement?
The same interface that lets you rediscover a book you forgot you owned, or did not know existed, can let an analyst make sense of a collection of documents or books they could not hope to personally read.
FIFA World Cup 2026 — Tournament Scenario Explorer
simscape.metiscope.com
Open the explorer →About this demo
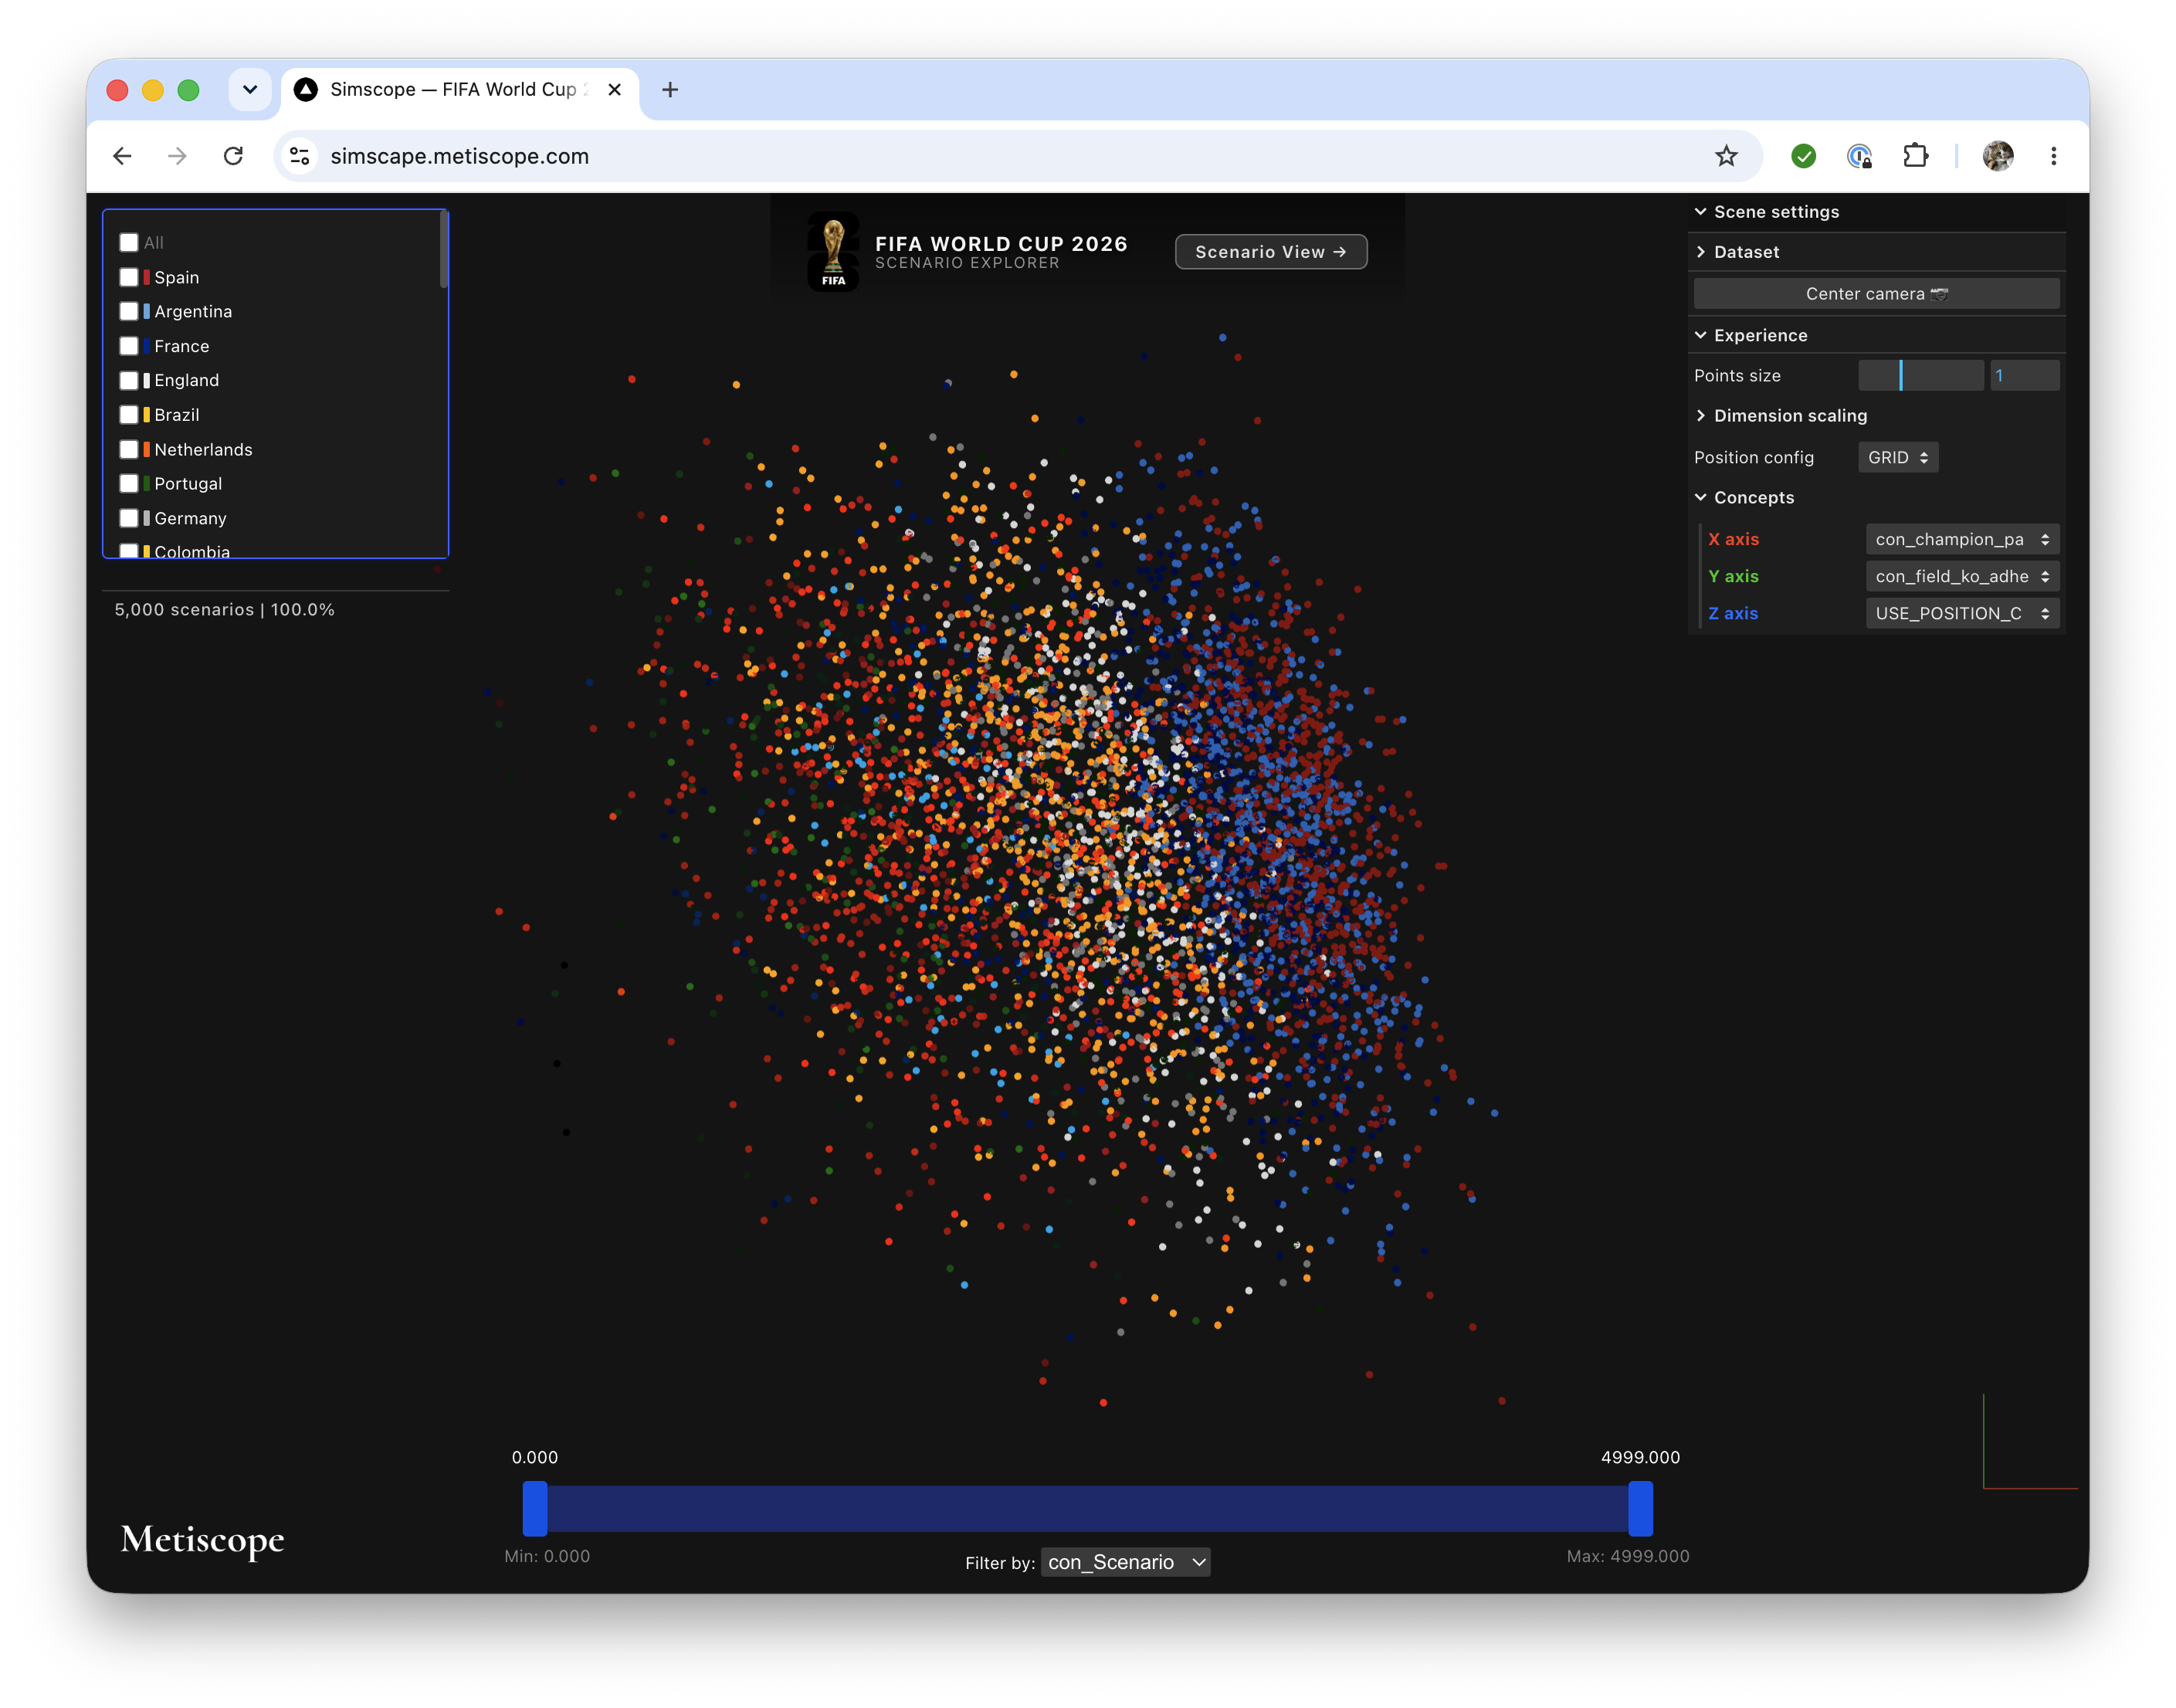
5,000 simulated tournaments, each a possible version of how the 2026 World Cup could unfold. Every dot is a complete tournament — from group stage through to the Final — generated using a Dixon-Coles football model calibrated to pre-tournament ratings.
The spatial layout reflects structural similarity between tournaments: scenarios with similar scorelines, upsets, and progression patterns sit close together. Colour the map by champion to see which nations dominate which regions of the space, and use the axis controls to move between "form" tournaments and upset-filled ones.
Click any point to open a full scenario view — the complete bracket from the Round of 32 through to the Final, alongside the group-stage tables.
Model
Dixon-Coles, ratings-calibrated
Scale
5,000 full tournaments
Interaction
Spatial map → full bracket
Why it matters
The football version is a demo. The real application is in domains where the stakes are higher and you have agency.
Customer demand in an economic shock. The health impact of a new class of drug. The effect of AI on the future jobs market. In each, the aggregate probability view isn't enough — the edge cases are where the risks and the opportunities live, and finding them needs an interface built for human exploration, not just a summary.
The point isn't to automate the insight, but to give people the ability to see and understand more than they ever could from a ranked list of probabilities.
Post-tournament update
Now that the 2026 World Cup has concluded, we have added two new scenarios to the simulation space, shown as larger dots.
The silver dot marks the fully deterministic tournament — the higher-ranked team wins every match. The gold dot is the tournament as it actually happened.
The two dots sit close together. The 2026 World Cup turned out to be a remarkably predictable edition: the 4 top ranked teams made the semi finals and the pre-tournament favourite, Spain, went on to win it. In the language of the model, the actual tournament had high field adherence and high champion path adherence — the bracket largely followed form, with few meaningful upsets along the way.
Covasim: A What If Scenario Explorer
About this demo
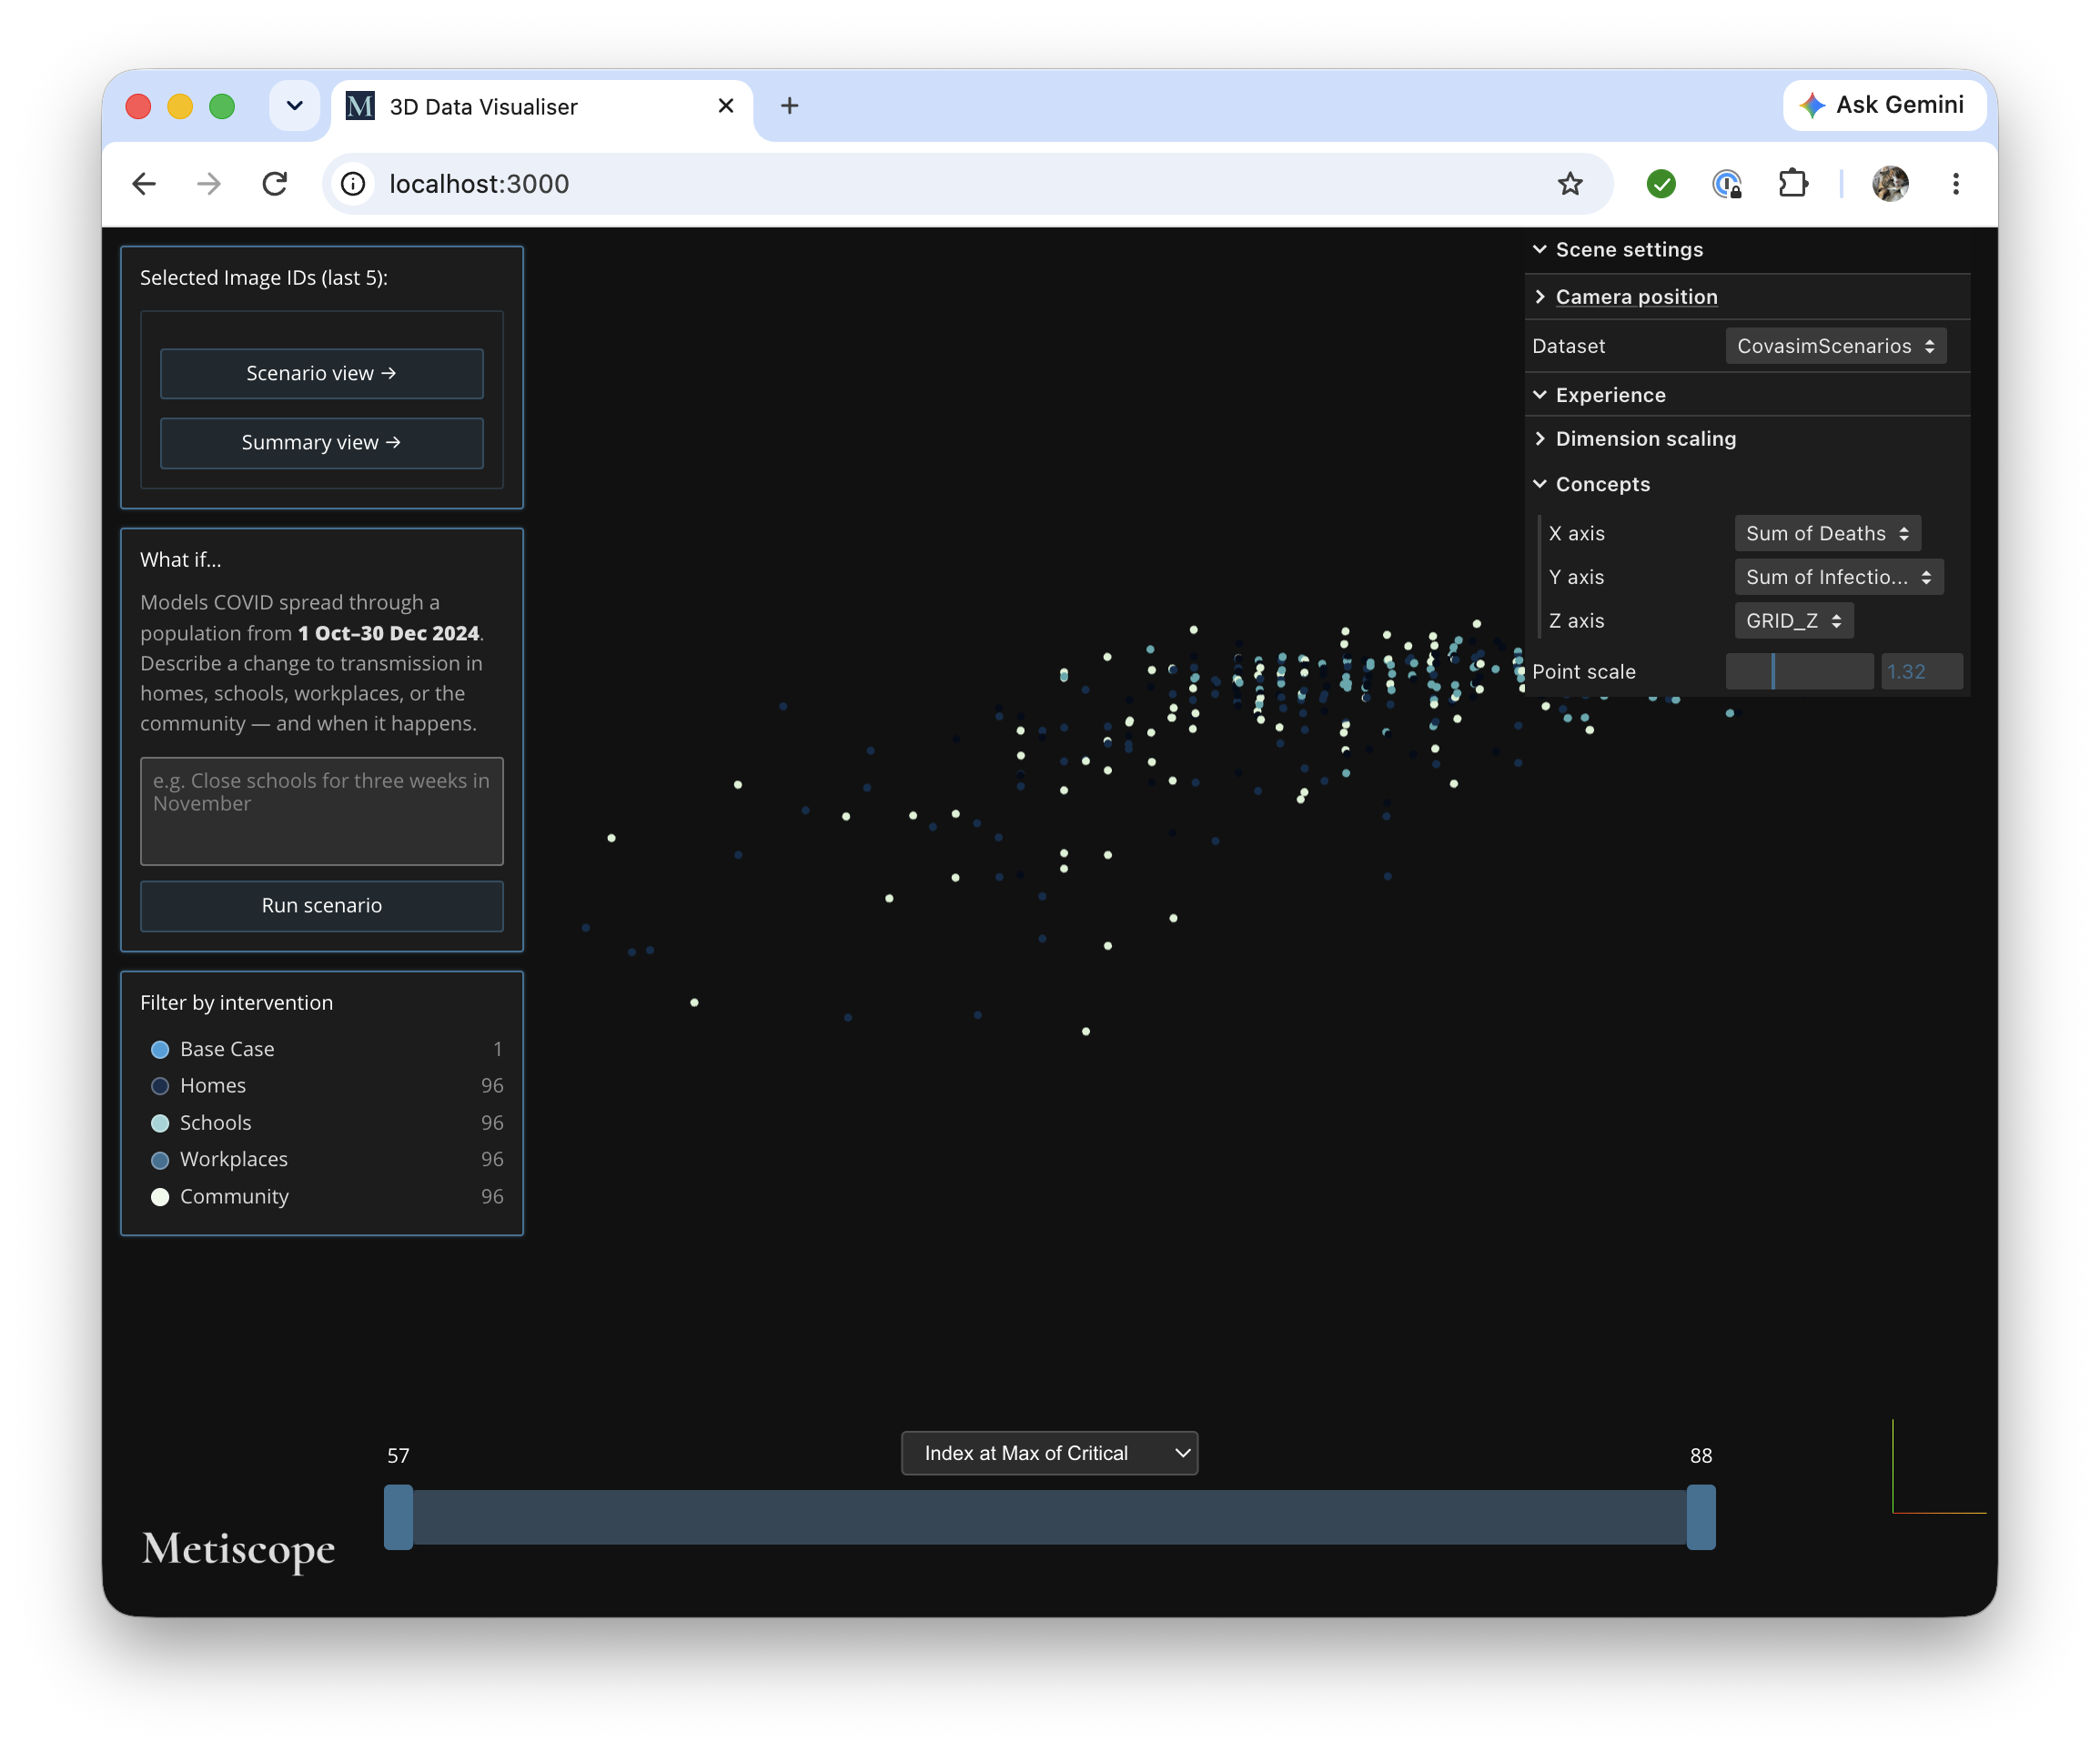
A 3D scenario explorer built on Covasim, the Institute for Disease Modeling's open-source COVID-19 agent-based simulator. It lays out a set of pre-run epidemic scenarios, different combinations of transmission interventions across homes, schools, workplaces and the community, as a navigable point cloud, then lets a visitor ask “what if” in plain English and see a real simulation run in response.
There are 385 pre-run scenarios: one base case plus 96 each for homes, schools, workplaces and community interventions. Twelve outcome measures, spanning peak and cumulative infections, severe cases, critical cases, deaths, and the timing of each peak, can be assigned to any axis, so the cloud can be rearranged by whichever relationship is interesting: peak infections against peak deaths, say, or duration against total cost. Dots are coloured by which layer the intervention targets, and a filter panel with a range slider narrows the cloud to scenarios within a chosen band on any measure.
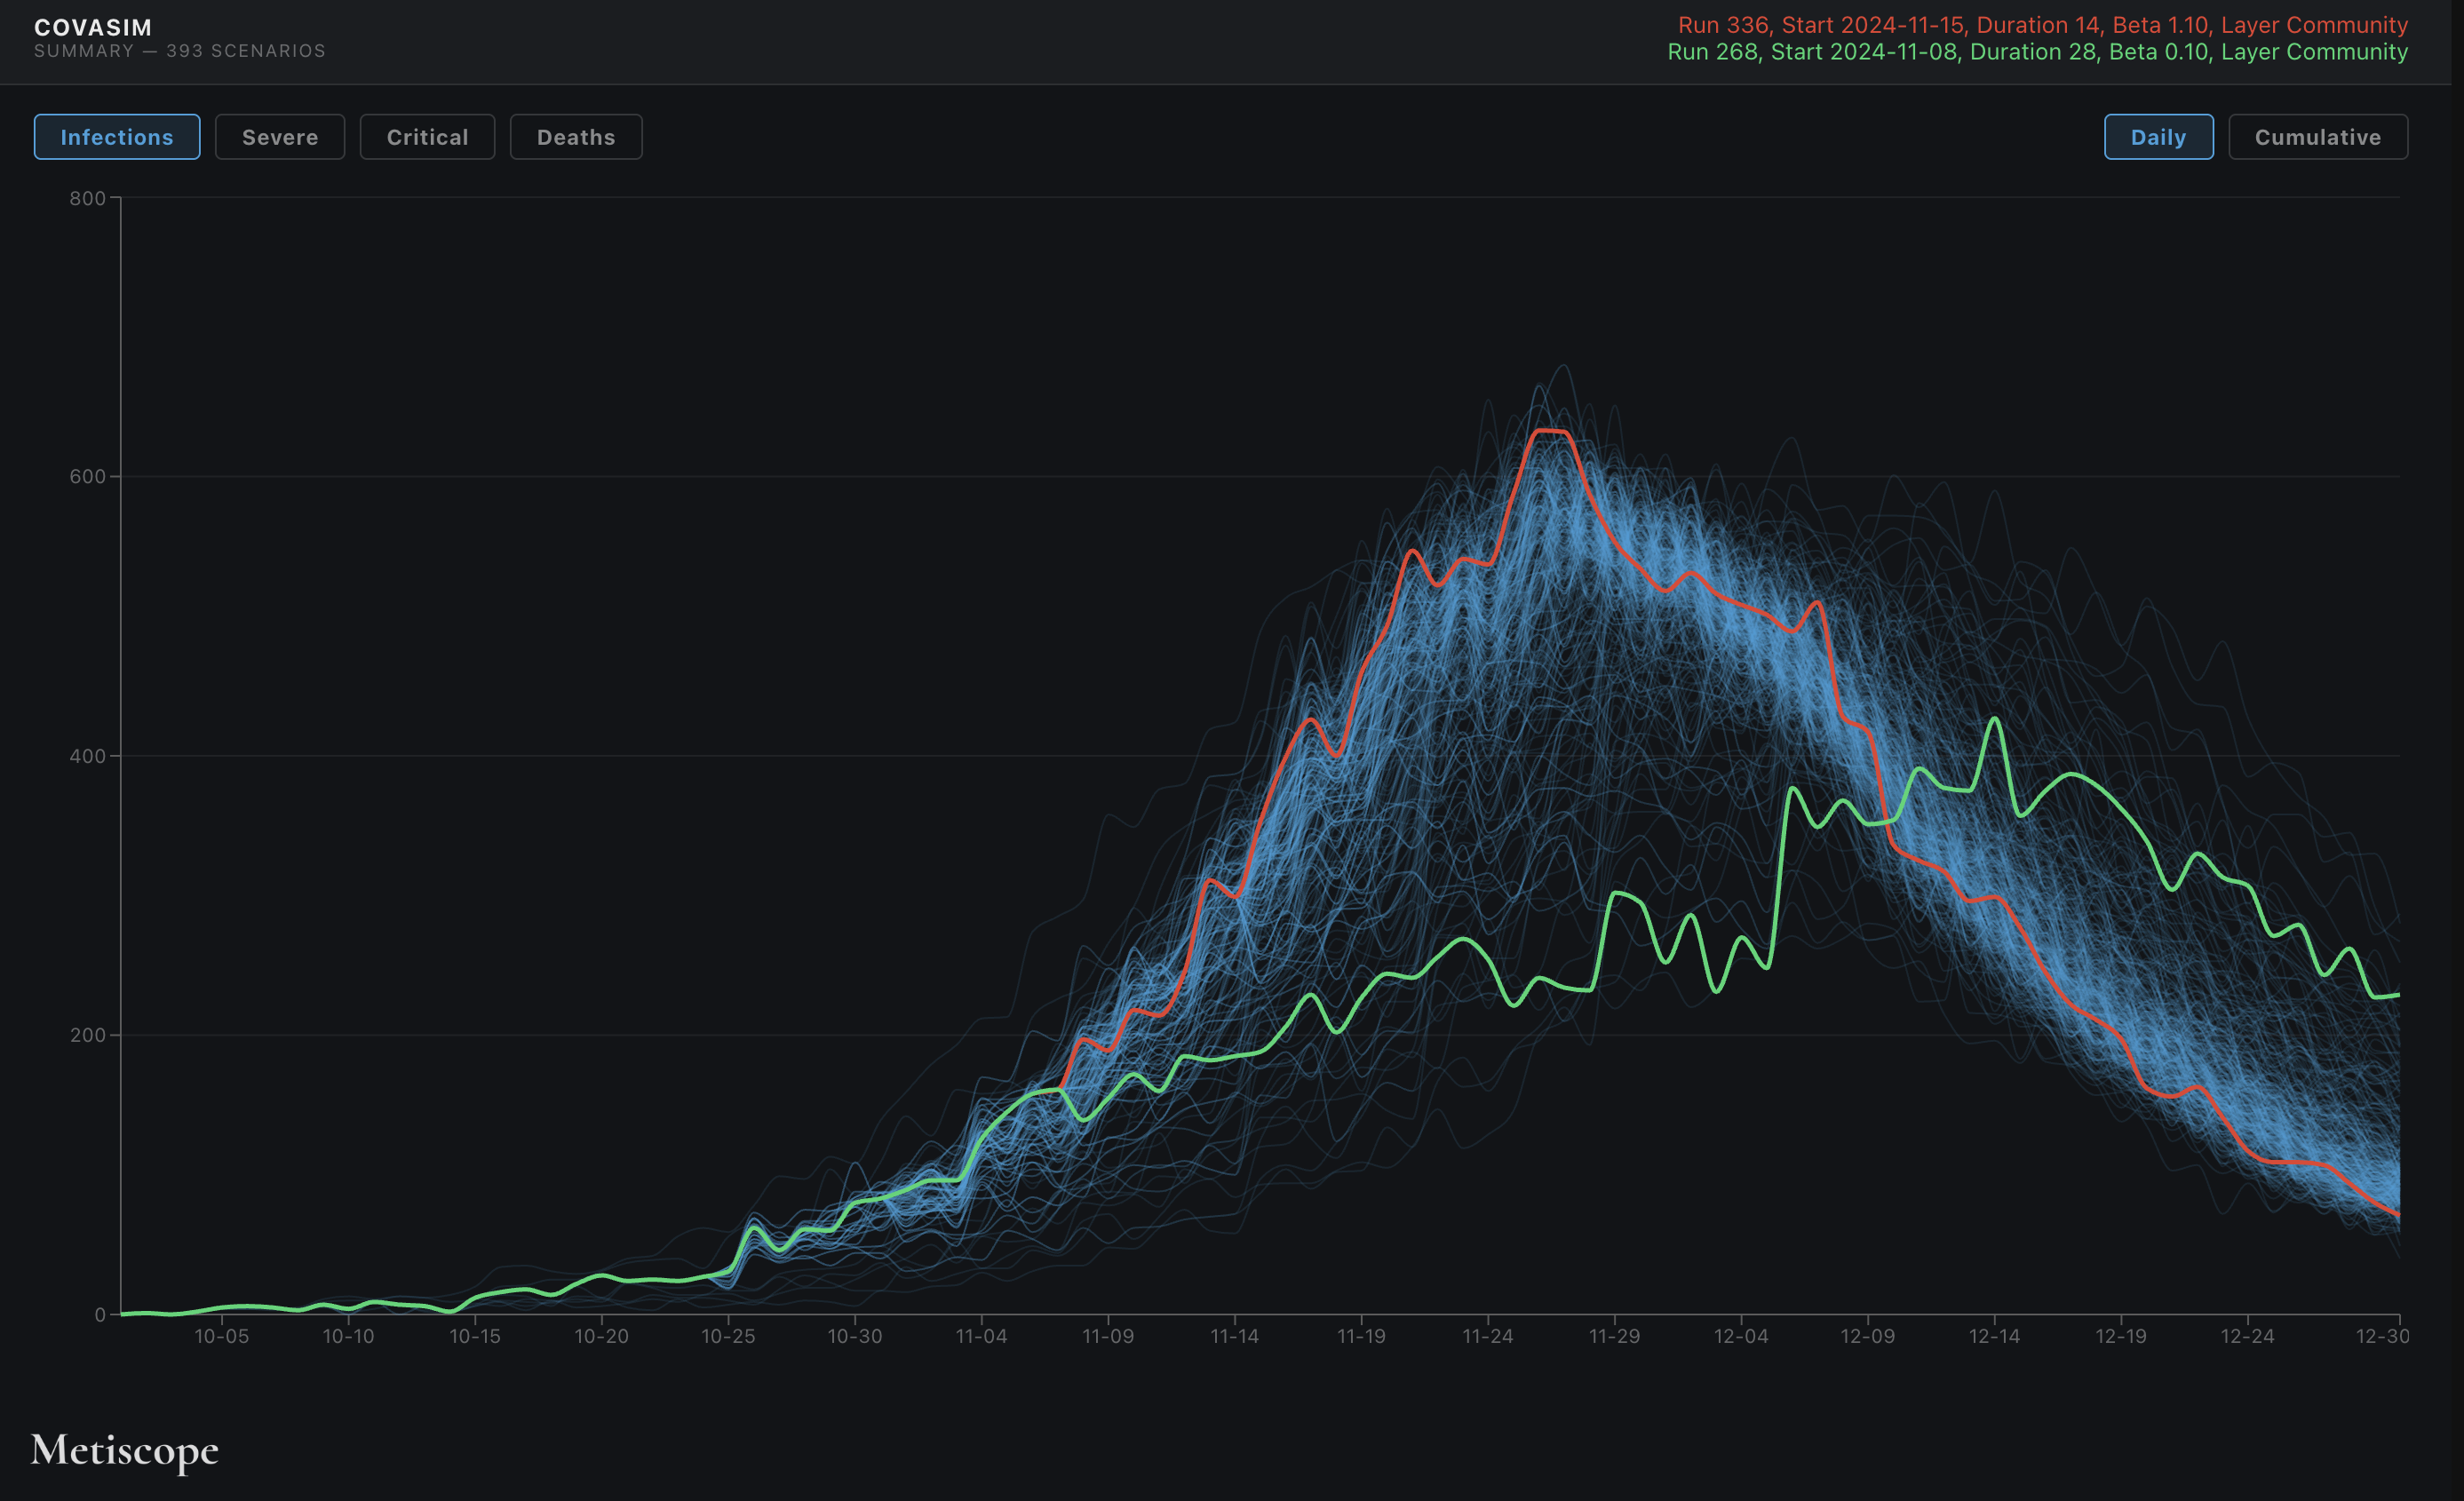
Clicking a scenario opens its details and either a chart of its own daily epidemic curves, with a second click bringing up a direct comparison against another scenario, or a summary view overlaying every curve at once with the selected scenario picked out in colour.
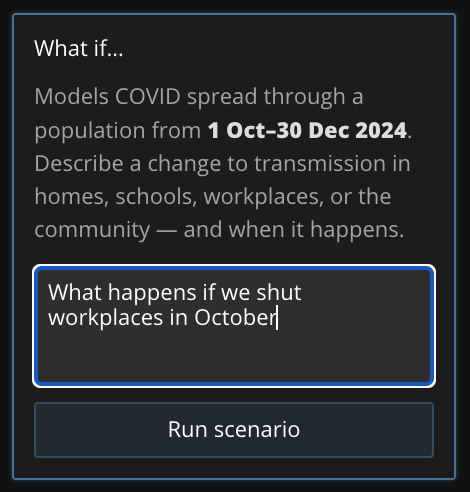
A visitor can also type a plain-English request, “close schools for three weeks in November,” “halve workplace transmission from mid-October,” and the app runs an actual Covasim simulation for it, live, server side. The new scenario appears in the point cloud within seconds, positioned correctly against the pre-run set, and persists for the rest of that session, so a visitor can build up several of their own scenarios to compare against the baked-in set.
Model
Covasim, agent-based (IDM)
Scale
385 pre-run scenarios, plus live runs
Interaction
Point cloud → epi curves, plain-English “what if”
Why it matters
This is a domain with genuine stakes, where the person looking has a decision to make.
An epidemiologist or policy planner exploring which interventions actually move an outcome needs more than a single model run or a chat answer. They need to see the shape of the intervention space before trusting a conclusion about any one part of it.
The point cloud builds understanding by mapping the intervention space. By changing which measure sits on which axis, and filtering by intervention type, they can see which interventions move which outcomes, across many cases.
However, looking at such a range of scenarios always begs the question “what if…?” In this interface the user can explicitly ask that question and get an answer. This capability can be used to train their intuitions about the efficacy of different interventions, and expand the evidence they might need to support a particular strategy.